

Everyone today wants to be sustainable. Universities, restaurants, governments, and even vintage clothing stores want to demonstrate to the consumer how environmentally friendly their practices are. While this trend towards going green is encouraging, unfortunately "sustainable" has become more of a buzzword than an actual practice.
In the design industry today, saying that one is committed to sustainability is easy. Firms merely highlight their best projects and say that they are always thinking about the planet. Rigorously tracking, analyzing, and refining one's practices is hard.
This summer, I'm working with SRG's Sustainability Group to collect and analyze building performance data from current and recent projects of significance. My efforts are not about painting a beautiful picture about how sustainable the firm is being (although SRG is doing quite a good job). It's all about the numbers.
Numbers are concrete, discrete pieces of information that provide a measurable truth about sustainability. Numbers provide the firm a way to measure the impact of its projects on the environment and then evaluate areas for future improvement and research. In this post, I will highlight my methodology for numerically looking at sustainability. This process is broken into three distinct steps: compilation, analysis, and data visualization. Each is talked about in detail below.
Compilation
The first step is compiling data on past and current projects and putting that data in a central location. This step is important because it is difficult to look at data when it is scattered to the four corners of a filing system. Data needs to be in a form where it can easily be organized, modified, and improved upon. It needs a home where it is easily accessible. This may seem like an obvious step, but it is important because it allows for a robust analysis that would not be possible otherwise.
Analysis
Once all the data is in a central location, it needs to be organized. Building data includes many metrics that can be used to measure how sustainable a design is. One could measure the impact that the building has on the storm water system or the amount of available day lighting in the building. Or one could look at the sustainable features of a building.
Of these metrics, one in particular stands out- the Building Energy Use Intensity (EUI). This metric represents the average amount of energy per year that a square foot of space in the building requires to function. In a carbon neutral building, this value is 0. This is also the metric used in the 2030 Challenge to look at how green a building is. I chose this metric to evaluate how sustainable a project is, because it can easily be combined with other building parameters to give a well-rounded picture.
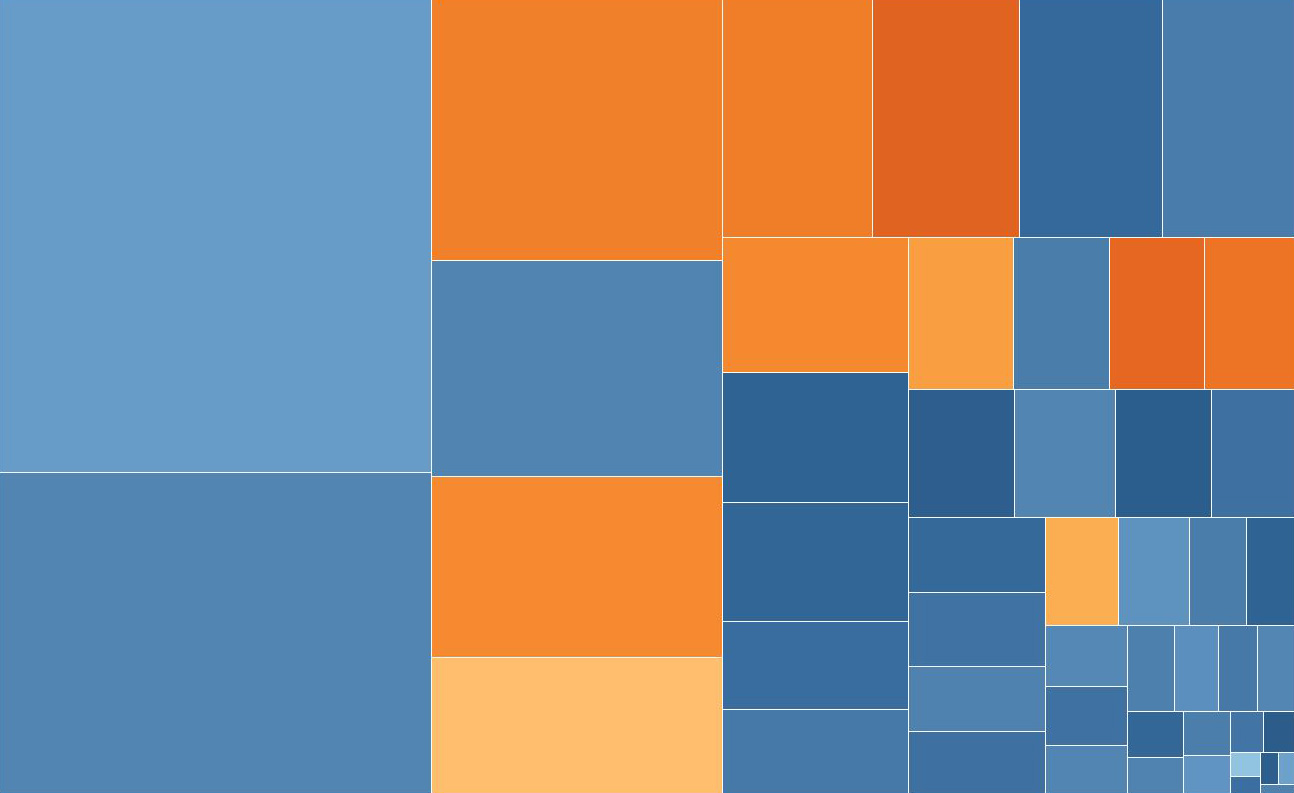
Data Visualization
One of the largest problems with numerical data is that it is difficult to present effectively. Nothing is more boring than having someone open up an Excel spreadsheet and say how the values and calculations in the sheet prove their point. That is why data visualization is so important. This step may seem unnecessary when one has a plethora of numbers to back up one's point, but it is critical. Data visualization effectively breaks down the communication barriers when talking about information. It combines visual elements with values of numbers into a final product that conveys the information in an interactive and tangible fashion.
All of this analysis and organization of data may seem a bit extreme when looking at how sustainable a firm is, but at the end of the day it gives a true picture of sustainability rather then a sugarcoated illusion. It will show how SRG is actively looking at improving and continuing to innovate in the field of sustainable design, rather then accepting things at face value.
At the end of the day, I think this is the better way to look at sustainability and that is why I am passionate about this type of work. It may not paint the best picture, but it does provide a meaningful one that's far more important when looking toward the future of the environment and innovation in the field of sustainability.
Ryan Stroud